#Bullish: Where do the markets go from here?

😯 Things get really interesting when you look back 10 years every month. Now, the data shows the market has gone up 95% of the time. Pretty close to always!
0 result
😯 Things get really interesting when you look back 10 years every month. Now, the data shows the market has gone up 95% of the time. Pretty close to always!
John is the Chief Investment Officer (CIO) at Secfi. An expert in portfolio construction and investments, he helps individuals maximize returns and control risks unique to their situation.
I’m John, the Head of Portfolio Management at Secfi. Most recently, I was a senior investment strategist at Dimensional Fund Advisors, where I also managed equity portfolios. I left to join Secfi because I saw the value they're bringing to the startup community. I also saw an opportunity to help individuals take the guesswork and anxiety out of their financial lives. And, I’m obviously excited about building unique investment portfolios for our startup employee clients, who certainly have unique financial situations.
That’s why I wanted to tackle this week’s Founders & Funders, to address a topic that’s likely been on everyone’s mind for most of this year: stocks. Yes, it’s been a rollercoaster year. And that may continue for a while. I can’t predict the future. Nor can any other financial “expert,” despite what they tell you.
But, what I can do is look at how the market has performed historically and use that to inform what we should expect. So, I did some digging and thought I’d share why I’m still optimistic about the future.
Also, I’ll be attending Money 20/20 with a few others from the Secfi crew (Fred, our CEO, is speaking!) at the end of the month. We’ll have a booth, so come by and say hi or reply here if you’d like to meetup.
#Bullish: Where does the market go from here?
🙉 Maybe you’ve heard this before. During the post-pandemic bull market, there was a tongue-in-cheek saying going around: “stonks only go up.”
It may feel like people forgot the tongue-in-cheek part, especially this year. But, here’s the thing — it’s not a completely ridiculous phrase. Especially when you look at the long-term historic performance of the public markets.
📉 It’s certainly true that stocks do, in fact, go down sometimes. But it also kind of depends on the time frame you look at. The longer the time frame, the more sure you can be that stocks will have gone up by the end of the time horizon. It’s never 100% certain, but with a long enough horizon, you can be as close to certain as it gets.
At least, that’s what the data tells us.
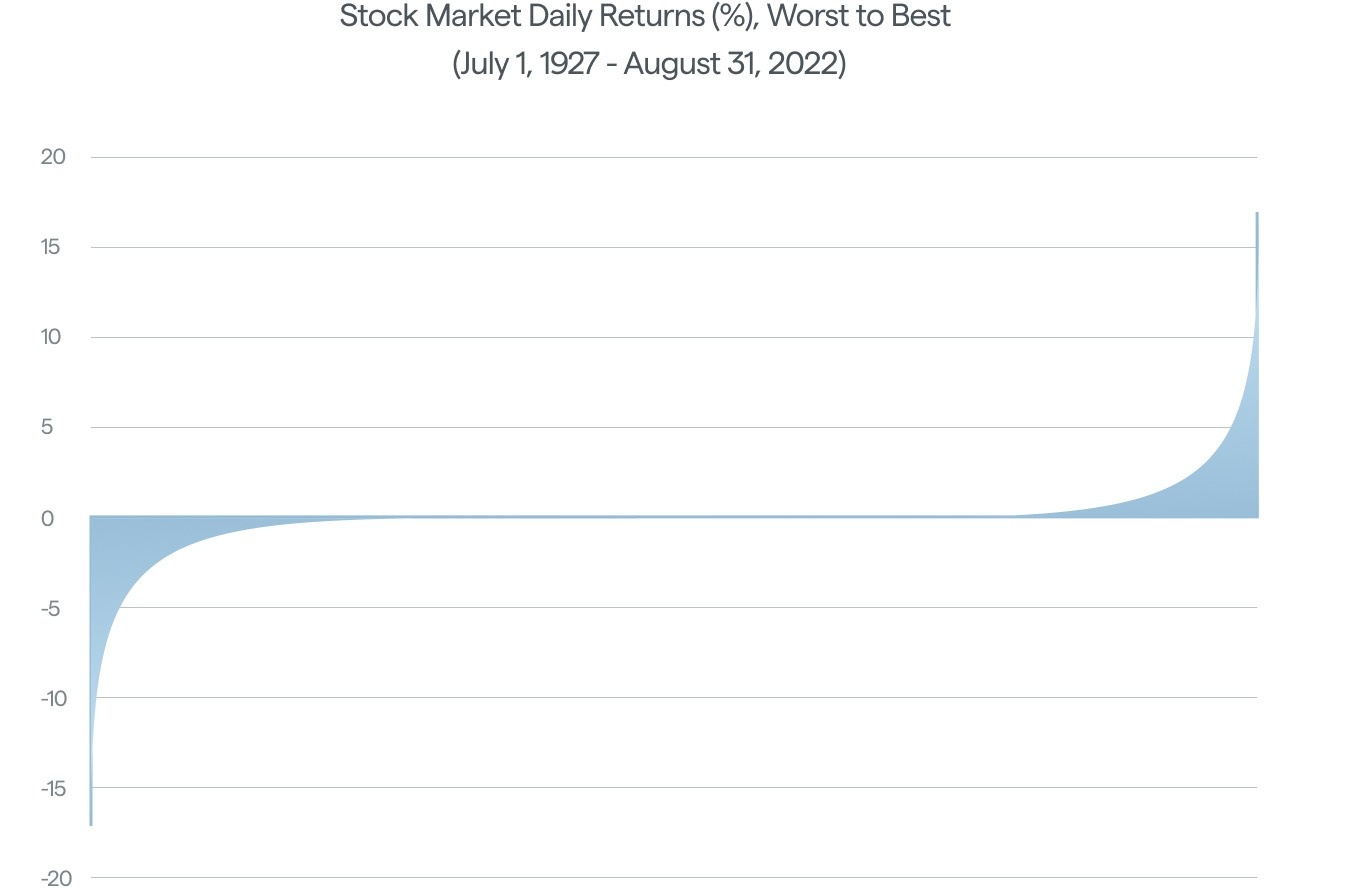
Let’s take a look at the data.
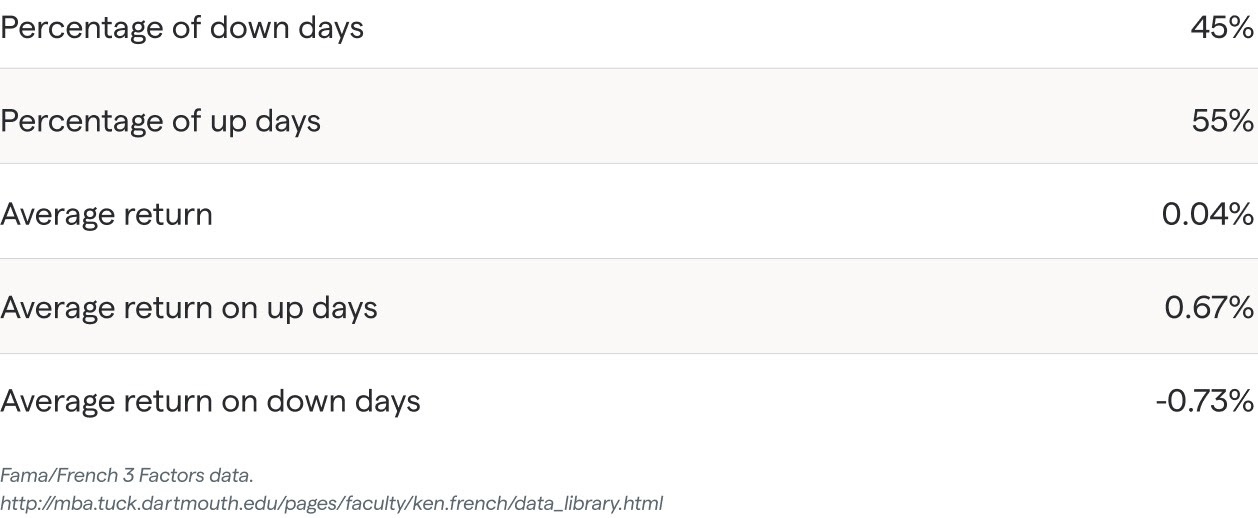
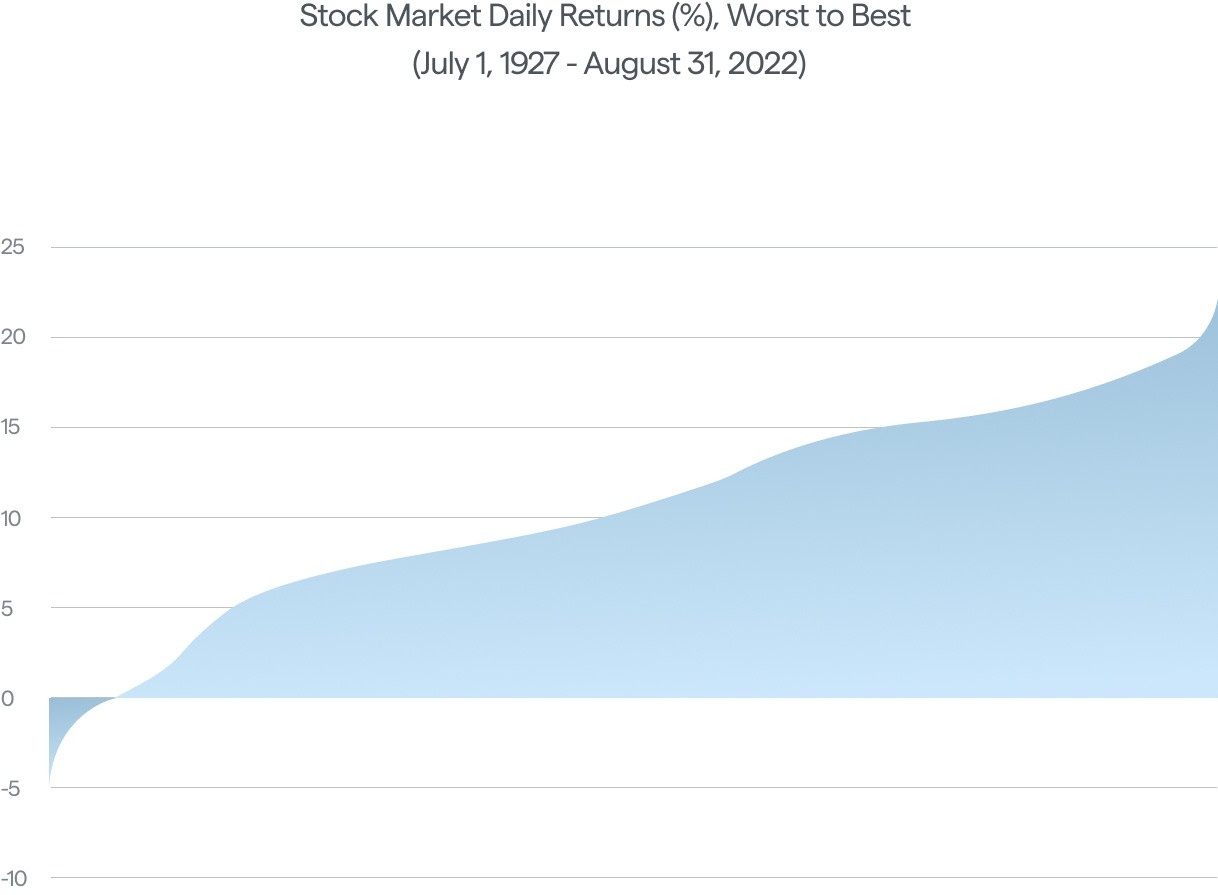
First, we’ll roll the calendar back about 100 years. Since 1927, the US stock market has gone up 55% of days, and down 45% of days. More ups than downs, for sure, but hardly a “stonks only go up” nail in the coffin.
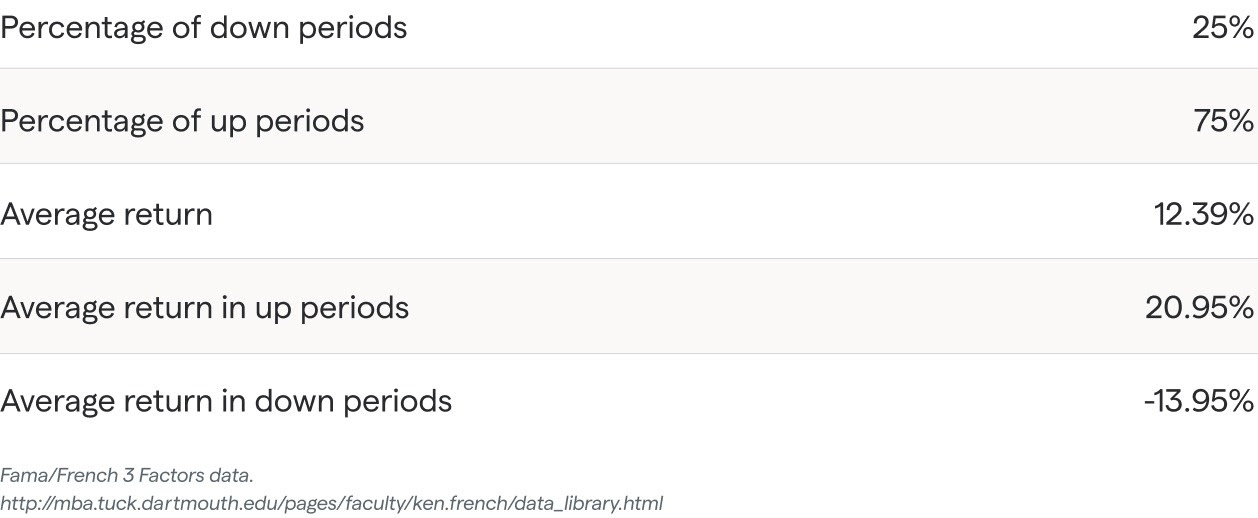
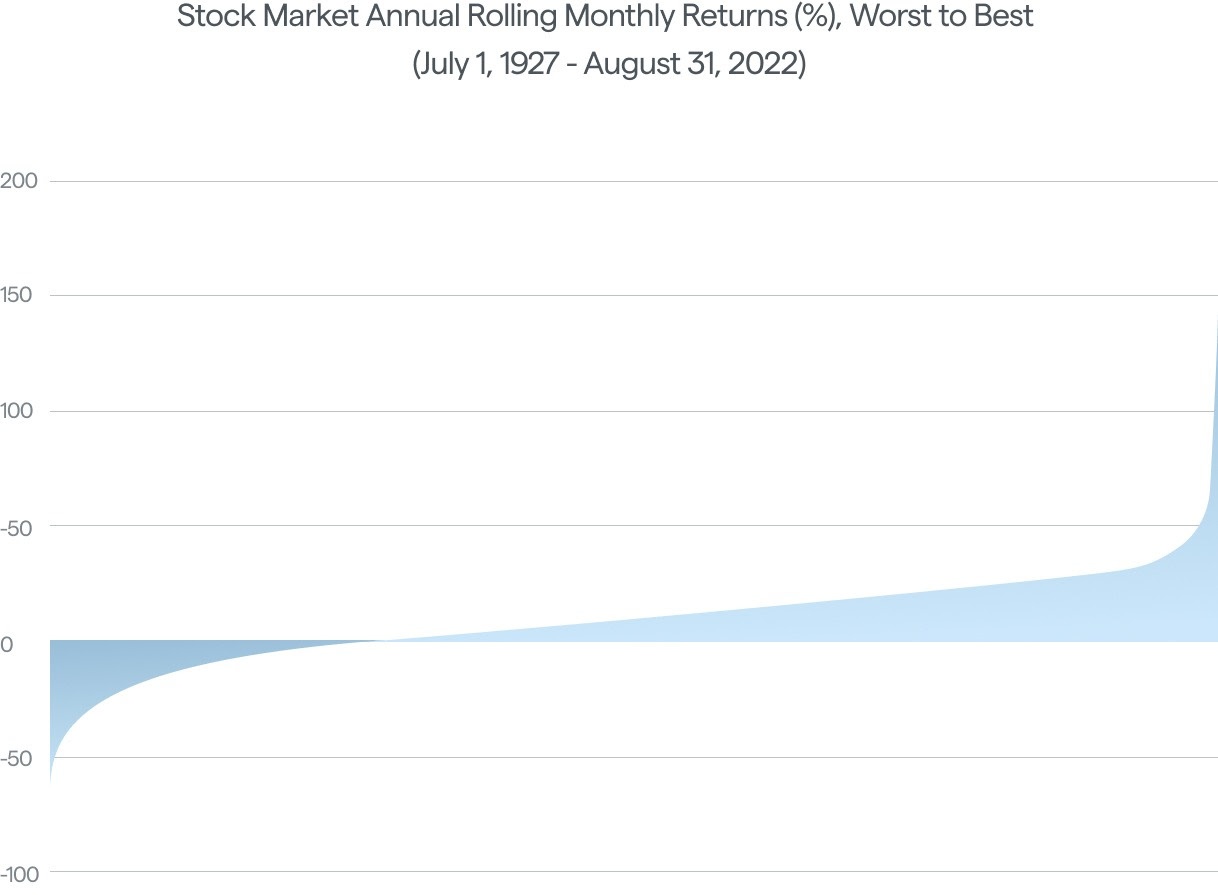
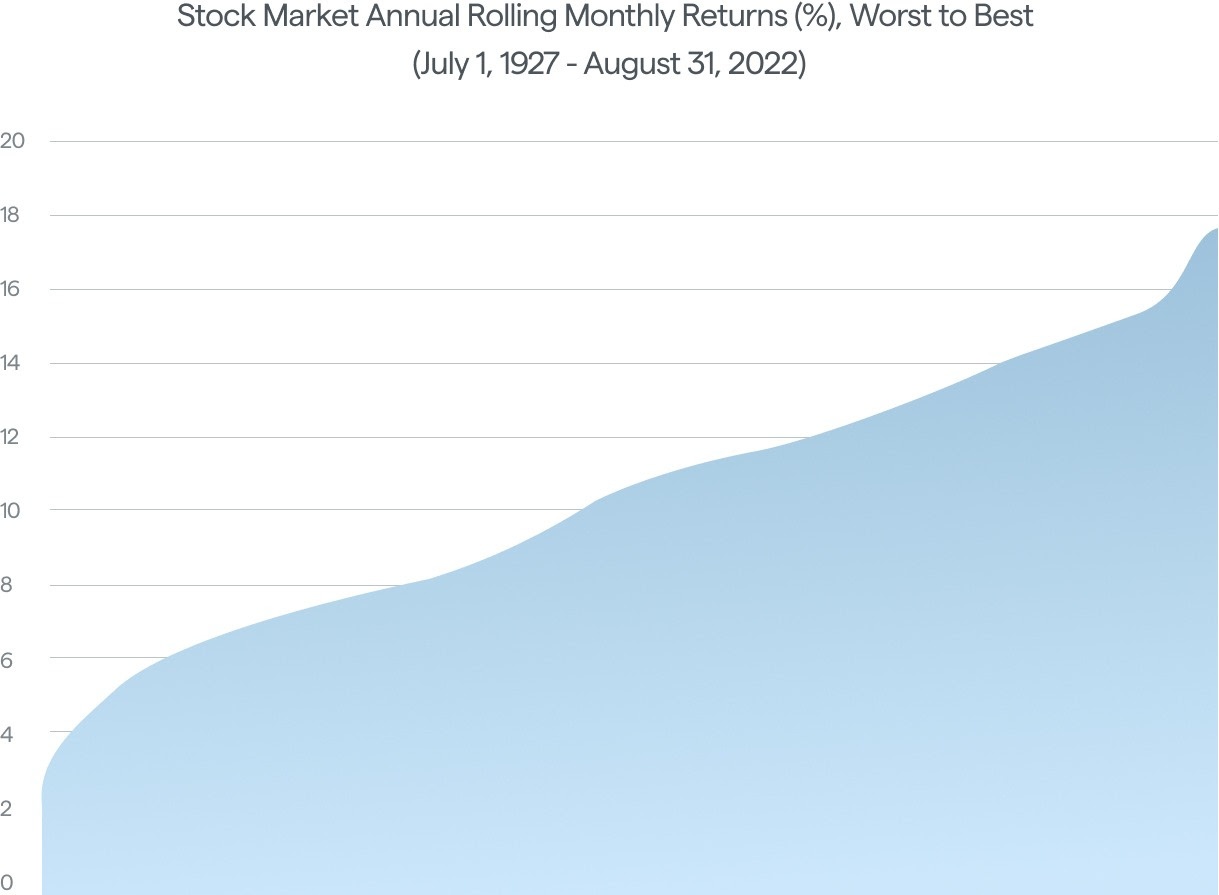
🤔 But things look a bit different when you stop looking at daily returns. If we instead look 12 months back from each month (i.e. rolling annual returns), suddenly things look better: the frequency of an up 12-month period improve to 75%. Much better than 55% but certainly far from perfect.
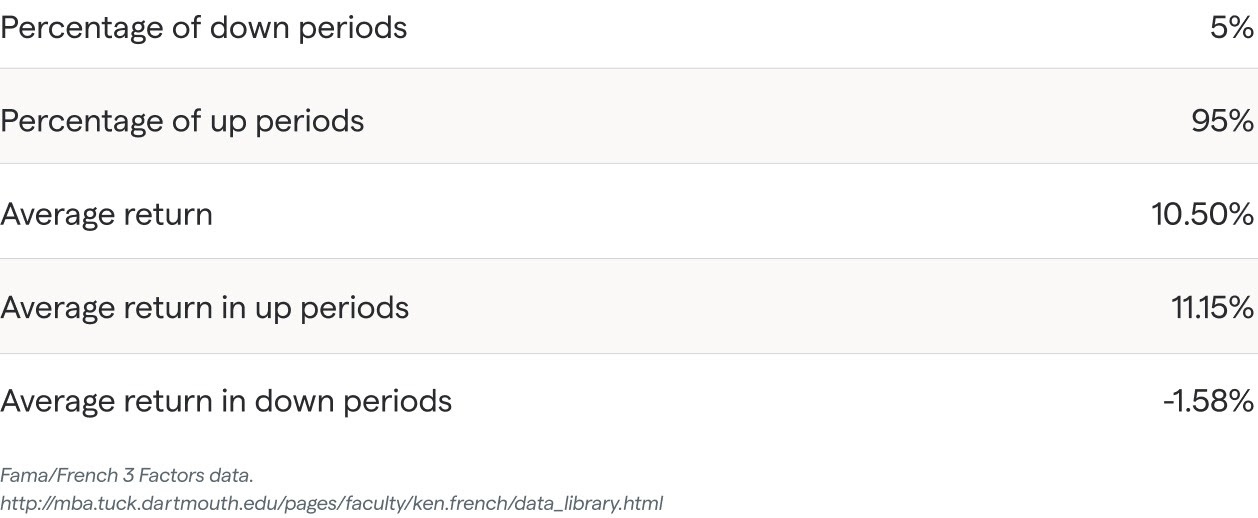
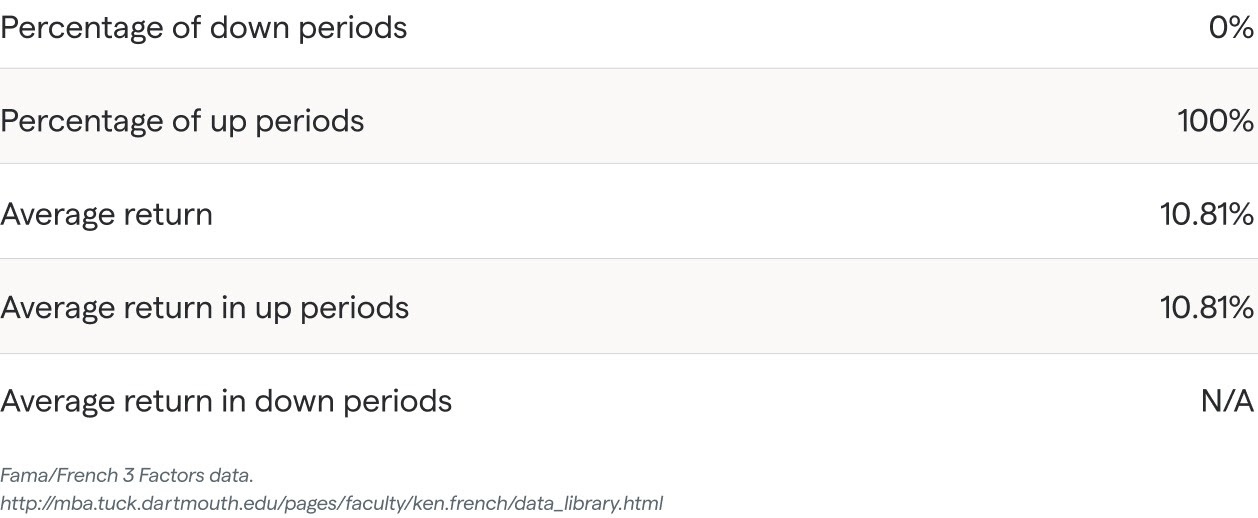
🤯 What happens if we take the long view, and only look back 20 years from each month? Well, we finally get to “stonks only go up.”
Never, in the history of the U.S. stock market (defined by the S&P 500 Index) have stocks lost value over a 20 year period.

In the short term, and in smaller historical increments, stocks do go down. Because, of course they do. Otherwise we’d all be making positive returns on our investments and stocks would be a no brainer, all the time.
But, once you zoom out your perspective to a pretty high level, you actually do get a high degree of certainty that stocks will have a positive return.
That’s why stocks are for people with long investment horizons. If you’re young, or just won’t need your savings for several years, owning stocks is a pretty good bet. But if you’re a day trader looking for a quick buck, or getting close to retirement, it’s no sure thing.
🤨 How is it possible that “stonks” really only go up? In short, because stocks are risky and investors are compensated for that risk with returns.
Ok, let’s break that down.
🤝 A share of stock represents partial ownership of a company. And stockholders are the owners of that company. Their ownership interest is represented by the number of shares of stock that they own. For instance, if a company has 100 shares total outstanding and you own 10 shares, you own 10% of the company.
🪜 But equity is also the lowest rung in the capital structure. This means that equity holders get paid last. Yes, they have a claim on the profits a company generates. But employees, suppliers, bondholders, etc. all get paid before equity holders get anything. This puts equity in a riskier position than other parts of the capital structure. Think of it this way: an employee is more likely to get their salary than a shareholder (that doesn’t work at the company) is to get paid, if push were to come to shove. Basically, equity gets whatever is left over.
💰 Because that’s a lot of risk to bear, equity holders demand a return. Because the risk is that there might not be ANYTHING left over after everyone else is paid, shareholders demand a return.
Side note: For folks in the startup community, the feeling of this risk and the return you expect, in order to be compensated for the risk, may sound familiar: Working for a startup and owning equity in a startup is far from a certain payday. You may take a hit on the salary you could command at more stable companies but in exchange, you expect to be compensated with ownership (equity). If the company is successful, your equity will likely become very valuable. And that’s compensation for the risk you took to work somewhere with an uncertain future.
🥇 The excess return expected by investors on equities is referred to as the “equity premium.” The equity premium is always positive on expectation. Nobody would buy stocks if the expected return was negative. And, if the price is too high today for expected returns to be positive, it will fall to a level where it becomes positive. Think of it this way: we may have to guess what the market will do tomorrow, or next week, or next month, but the expected return over the long-term is always positive.
❓ If it’s always expected to be positive, why do we have the market we’re seeing now? Realized returns don’t match expected returns in the short-term because the world is a messy and uncertain place. New information is coming out all the time that influences what we think the future might hold.
And, that new information moves the price of equities around like a whipsaw because a share of stock is a claim on all the residual cash flows of a company, for eternity. Anything that changes the prospects of the company in the future can affect the price today in a big way because the entire lifecycle of the company is expressed in the market price right now. Think about all the negative information that has hit the market this year, inflation higher than expected, war in Europe, geopolitical uncertainty, etc. etc. It’s no wonder stocks have fallen in response.
The reason returns become more certain over longer periods of time is because the unexpected portion of realized returns (based on that daily flow of information) is noisy. But, over time, it washes out and fades into the background. Sometimes there are surprises on the upside and sometimes on the downside, but in the long-run, you tend to get the expected return as these noisy short-term effects offset each other.
📈 All of this is why I’m long-term bullish and always will be. Risk and its expected return are connected. When risks are high, expected returns are high. But the key is to take the right risks. Fortune does not actually tend to favor the brave. Taking reckless risks does not put the odds in your favor. But taking compensated risks intelligently does.
I much prefer Louis Pasteur’s take on risk: “Luck favors the prepared mind.” If you can take the right risks, in the right way, you can reap large rewards with little to no chance of blowing yourself up.
Things we’re digging: