✨ Year-end reflections: the magnificent seven’s market reign

0 result
John is the Chief Investment Officer (CIO) at Secfi. An expert in portfolio construction and investments, he helps individuals maximize returns and control risks unique to their situation.
The US stock market has been on a tear this year. Through December 20th, the Russell 3000 Index returned ~25%, the more concentrated S&P 500 returned ~26%, and the even narrower Nasdaq 100 returned ~28%. With all the chatter about the “magnificent seven” dominating, I was curious to see how much of the year’s returns were driven by these large names. I also wanted to understand if such narrow market leadership is an outlier or just part of the investment journey.
First, some facts, the largest 7 companies by market capitalization on 12/20/2024 were the following, and popular indices held them in the below weights:
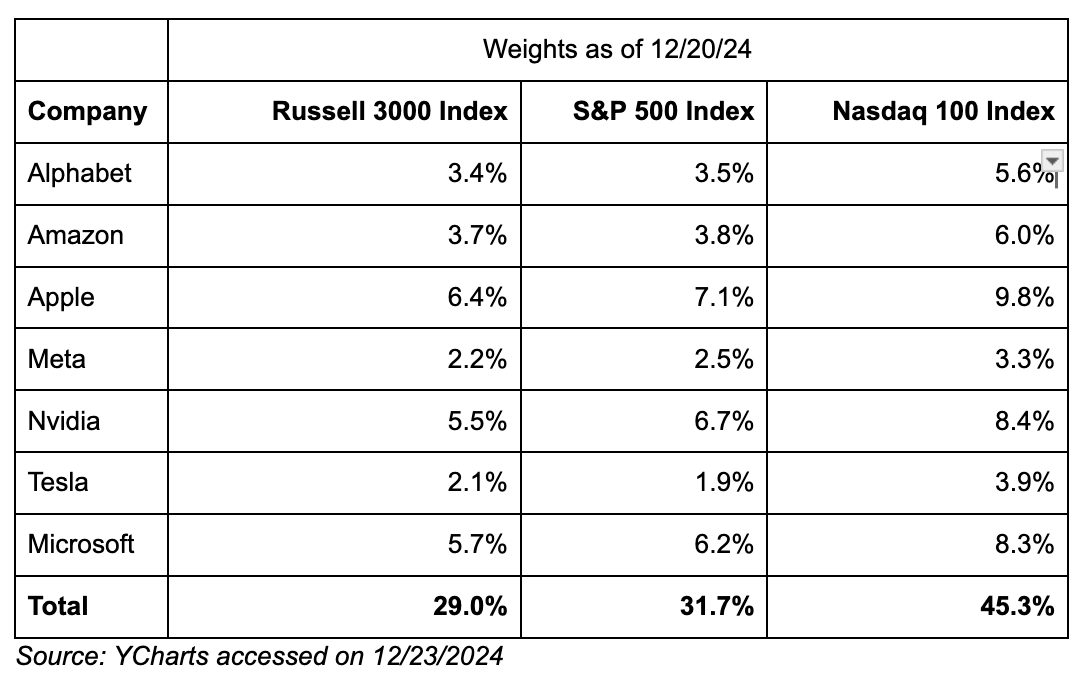
A few observations; these 7 companies make up a large portion of the American stock market, all of them are considered technology firms, despite what the official sector classifications say, and each of them is expected to benefit from the burgeoning AI industry.
Is stock market concentration in the largest companies an anomaly? Do the largest companies tend to be involved in new technologies? In other words, is this weird?
Is it weird for all the largest companies to be leaders in innovation? Historically, the largest companies have generally been pretty innovative and successful, that’s how they became the largest. In the 1930s and 40s telephones and automobiles were cutting edge and AT&T and General Motors dominated the market cap rankings. As the economy shifted the leaders shifted, but it’s unremarkable for the largest names to be the innovative players of the day. The information technology sector concentration is a bit of a new profile for the market, but in my opinion, that simply reflects how the economy has evolved over time and isn’t something to lose sleep over.
Market leaders at the beginning of each decade over time:
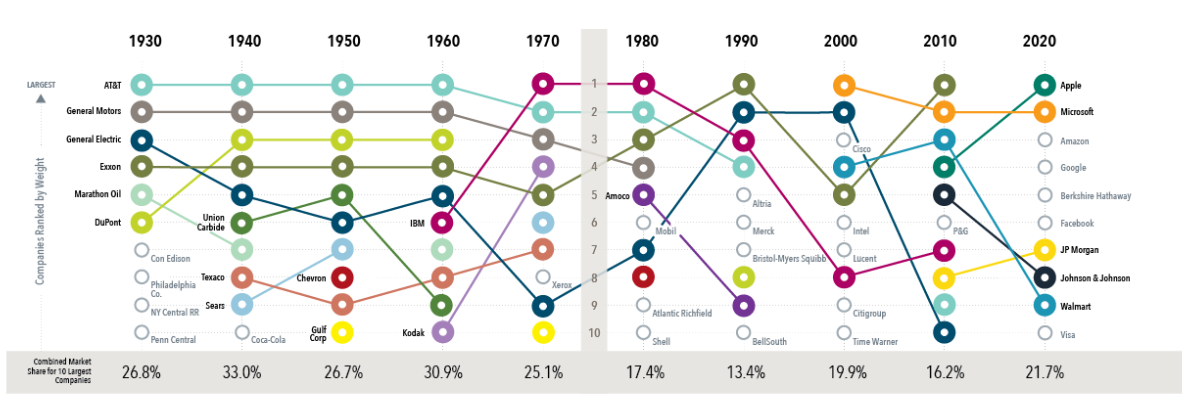
Source: Large and In Charge? Giant Firms atop Market Is Nothing New.
So market concentration has increased recently but we’ve seen similar levels of market cap concentration in the past.
What about the returns to these mega-cap companies? Let’s look at the individual company contributions to the Russell 3000 Index return so far this year. This is roughly the weight of the stock in the index at the beginning of the year multiplied by its return year-to-date.
Top 20 contributors and detractors to the Russell 3000 Index return through 12/20/2024
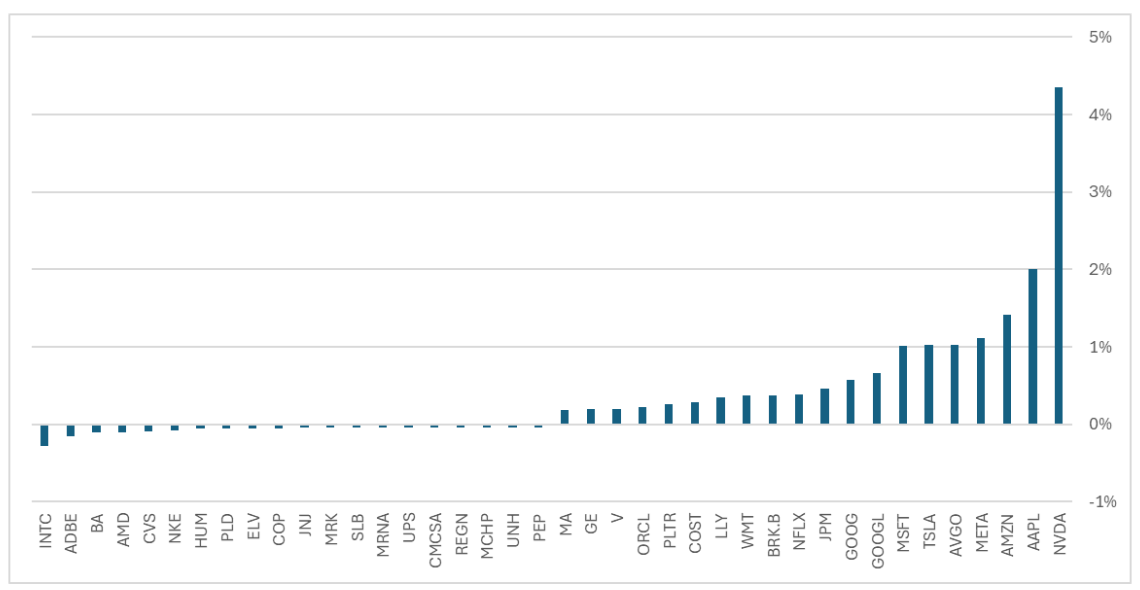
How much of the total stock market return was driven by the largest 7 companies? A lot! Nearly half of the 25% YTD index return was delivered by just 7 companies. So ~0.2% of companies delivered ~50% of the return. Is that weird? The answer is an unsatisfying, “kinda”. It’s unremarkable that a minority of companies delivered the majority of the returns, that’s a pattern that has been true since stocks started trading1. Additionally, if you look at the largest contributors to returns, it’s always going to look crazy because we’re looking at the extremes, by definition. What is weird, is that some of these behemoth companies had extremely positive returns in 2024. That is an anomaly. Historically, after a company becomes one of the biggest, it tends to lag the market overall2. NVDA alone contributed ~18% of the market return this year. One stock out of 3000! I would be surprised if that isn’t a record.
From the data, the majority of companies underperformed the index this year (~70%)3. That is normal. Most stocks underperform, it’s a fact. If you’re picking stocks in a concentrated way, the odds are stacked against you from the get-go. A random stock pulled out of a hat is objectively worse than the bundle of all the stocks. Historically, just ~35% of companies outperform the market on average over a 5-year period4.
In summary, market concentration is not new. Additionally, wide performance dispersion and narrow market leadership is pretty typical. However, the extent of the market leadership does seem to stand out. Historically, the biggest companies haven’t outperformed the rest of the market by this wide a margin.
What do we do with all this info? I offer three things:
Don’t get sucked into the FOMO. What has happened recently may not continue to happen. If your portfolio is concentrated in the Magnificent 7 or the Nasdaq 100 for that matter, you’re relying on just a handful of companies for your portfolio return, that may turn out well, but it’s a concentrated bet and you should make that decision consciously.
The current cohort of dominant companies probably won’t be the dominant companies forever.
Expectations for AI are clearly high as evidenced by the returns of stocks connected to AI. People are expecting big financial results. Are they coming? Will they be better or worse than expected? And when? The answers to those questions will probably drive returns one way or another in 2025.
1 Bessembinder, H. (2017). Do Stocks Outperform Treasury Bills? Retrieved from SSRN
2 Dimensional, using data from CRSP and Compustat. Includes all US common stocks. Largest stocks identified at the end of each calendar year by sorting eligible US stocks on market capitalization using data from CRSP. Market is represented by the Fama/French Total US Market Research Index. Excess return for each stock is the difference in annualized compound returns between the stock and the market, computed from the first month following initial classification in the top 10. Stocks in the sample are required to have at least 36 months of returns data following classification in the top 10.
3 YCharts data, accessed December 24, 2024.
4 Dimensional Fund Advisors. (n.d.). Singled Out: Historical Performance of Individual Stocks. Retrieved from https://www.dimensional.com/us-en/insights/singled-out-historical-performance-of-individual-stocks